
Market data across a sample of 11 UK cities reveals a nearly threefold gap in the share of term-time nights generated by 30+ day bookings – from 22% in one city to 59% in another. That variation shapes everything from operational intensity to pricing strategy. Here’s what the data shows.
Every operator running a multi-city portfolio knows that short stay demand is highly localised. But it’s one thing to feel that intuitively, and another to see it quantified.
We analysed term-time short stay market data across a sample of 11 UK cities, looking at booking duration mix, operational intensity, and lead time patterns. What stood out wasn’t that cities vary, it was how stark that variance is.
The duration mix
Stays of 30 days or longer – typically placement students, exchange programmes, and non-standard academic patterns – are a significant and growing segment of term-time short stay demand. But the degree to which they contribute varies enormously by location.
In Nottingham, 30+ day bookings account for 59% of all term-time nights sold. In Sheffield, 58%. In Bristol and Birmingham, the figure sits in the mid-50s. At the other end, Belfast generates just 22% of its term-time nights from stays of a month or longer. Edinburgh sits at 32%.
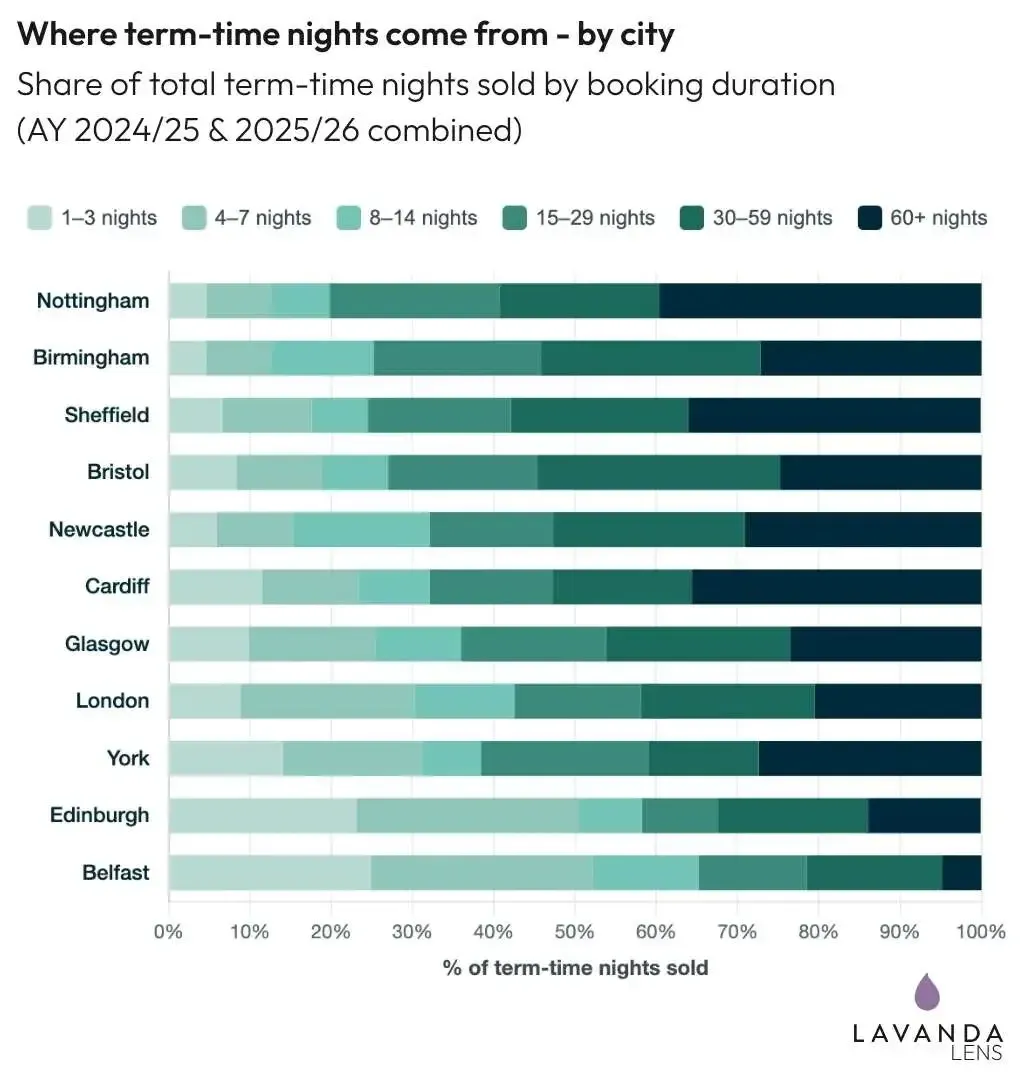
A nearly threefold spread. Same label of “term-time short stays”, but underpinned by structurally different demand markets.
Three profiles
The data clusters into three broad groupings:
- Long-stay weighted: Nottingham, Birmingham, Sheffield, Bristol, Newcastle, and Cardiff. Stays of 14+ days generate between 70% and 82% of all term-time nights. Average stays range from 10 to 16 nights. The margin opportunity here is occupancy volume per transaction – fewer turnovers, lower operational overhead per night sold.
- Short-stay weighted: Edinburgh and Belfast. Stays of seven nights or fewer account for more than 50% of all nights sold and close to 90% of transactions. Average stays of six nights or fewer. The margin opportunity is different: higher nightly rates, more dynamic pricing leverage, and a broader demand base.
- Blended: London, Glasgow, and York. No single duration segment dominates. London’s profile is notable for its 4–7 night concentration (22% of nights, the highest of any city), reflecting the volume of international visitors, open-day trips, and short professional stays.
Each profile creates value differently. The question is whether the operating model behind each programme reflects that, and is optimised accordingly.
Operational intensity
Every booking triggers a fixed operational cycle – comms, access, check-in, turnover. The frequency of that cycle relative to occupancy generated varies nearly threefold.
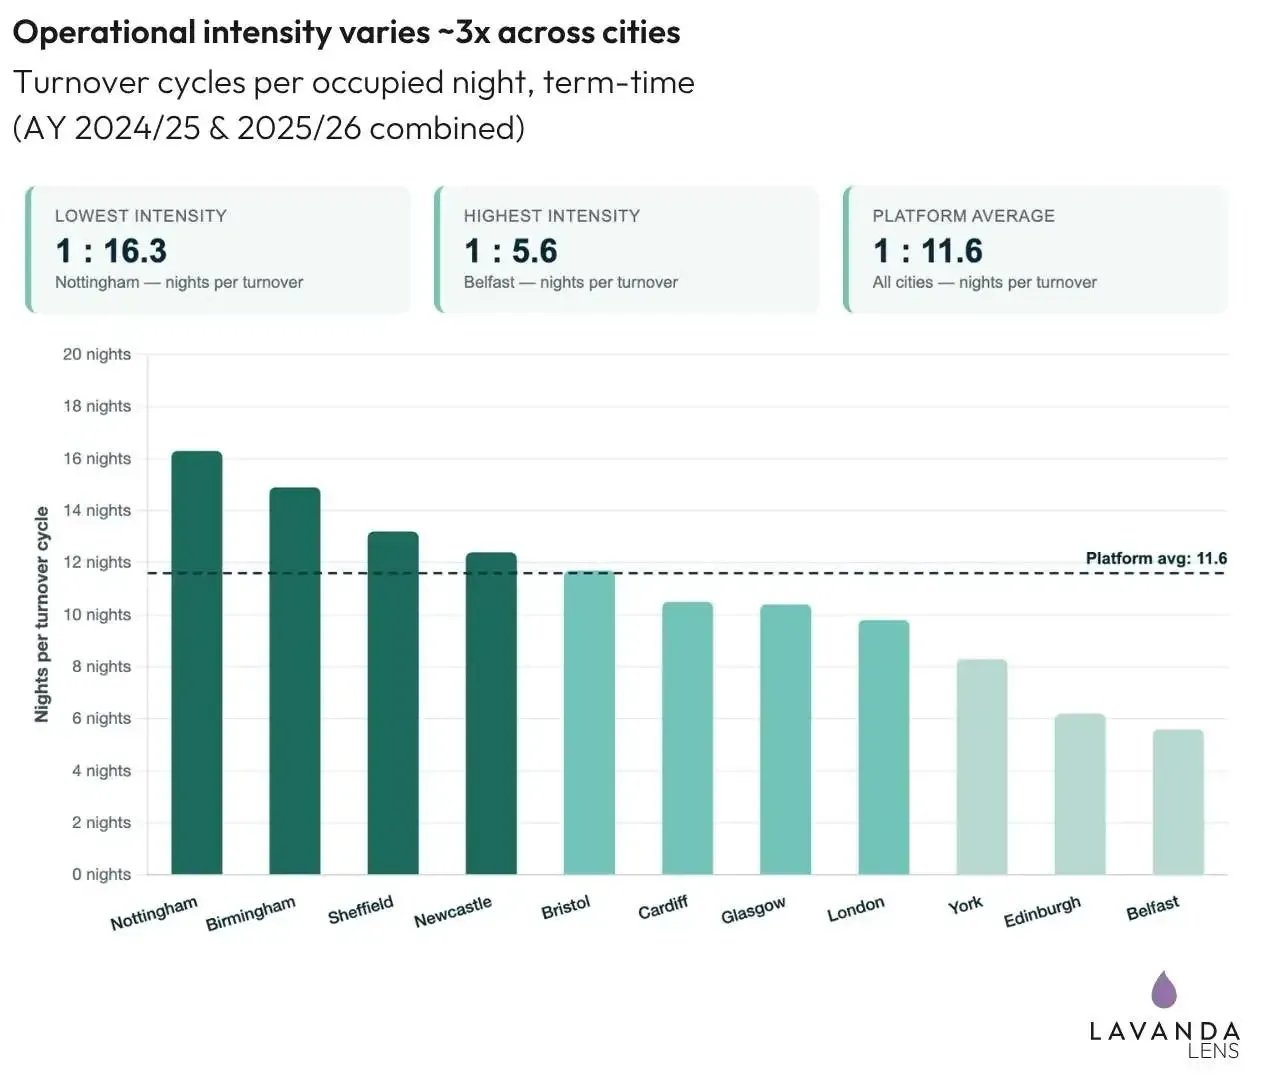
In Nottingham: one turnover per 16.3 nights of occupancy. In Belfast: one per 5.6. Neither is inherently better – a low-intensity market earns through volume per transaction; a high-intensity market earns through yield per night. The issue is misalignment: a high-intensity city priced like a low-intensity one will underperform on yield, and vice versa.
Lead time
Booking lead times reinforce the case for local strategy.
In London, 35% of term-time bookings arrive a month or more before check-in. In Birmingham, 12% – with 48% booked within a week.
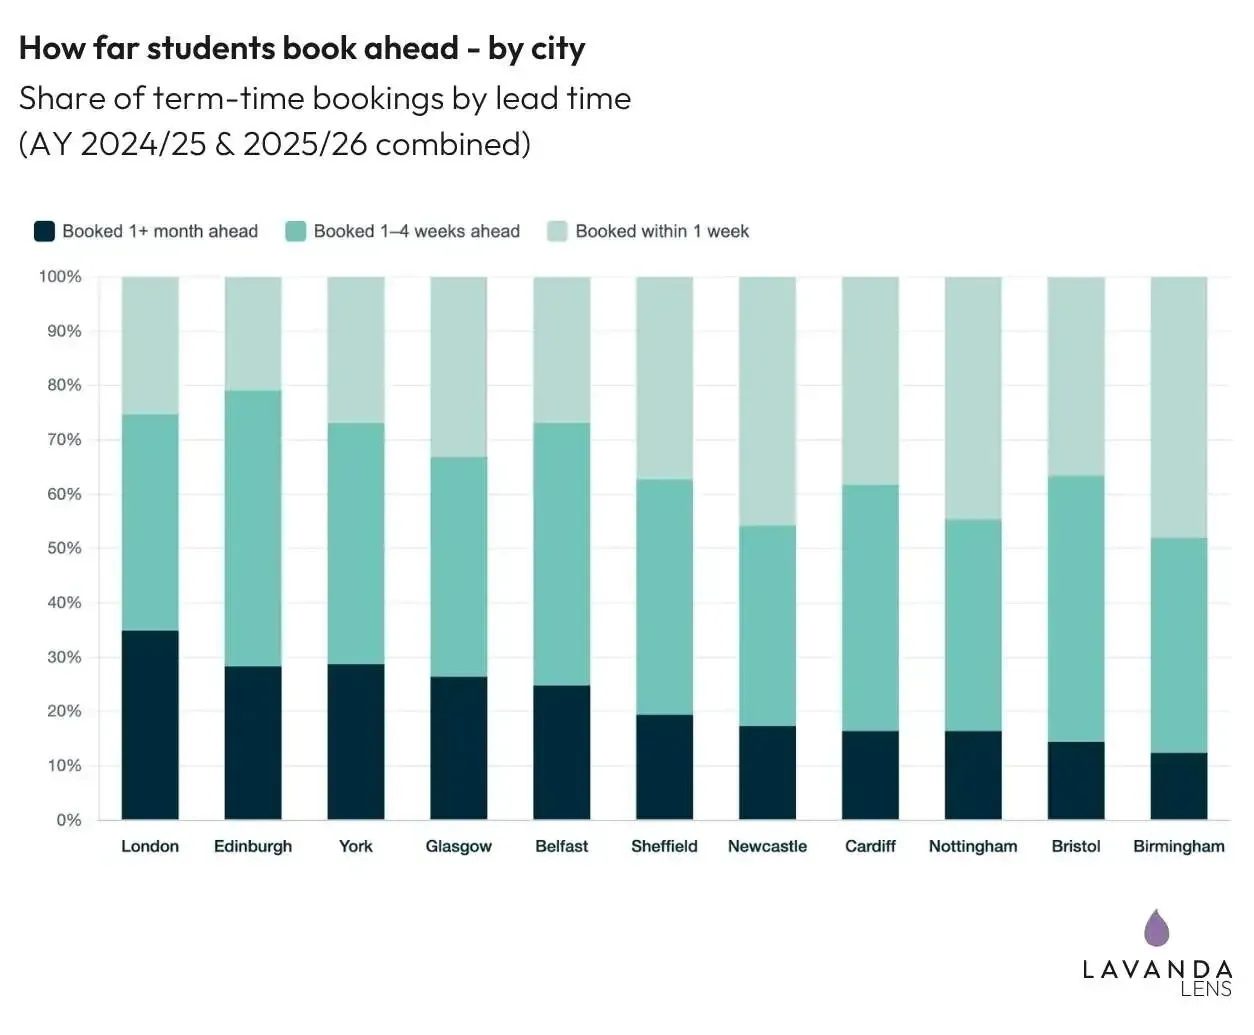
Counterintuitively, several long-stay weighted cities see higher rates of spontaneous booking – likely reflecting students responding to confirmed placements at short notice rather than planning months ahead. Short-stay markets, where parents and visitors are a bigger share of demand, tend to book further out.
The revenue management implication is straightforward: cities with high spontaneous demand need availability held open closer to check-in. Cities with longer lead times can be more aggressive with advance rate structures. A blanket pricing curve applied nationally is a silent source of lost revenue.
What it means for pricing
An operator running assets in Nottingham and Edinburgh is running two different businesses under the same label. One earns its margin through occupancy volume per transaction. The other earns through pricing flexibility across a higher frequency of bookings. Both can be highly profitable provided the operating model is aligned to the demand.
The operators extracting the most value from term-time aren’t the ones with the best national template. They’re the ones with the clearest read on local demand at the building level, and a strategy built around it.
Get in touch if you’d like a free illustration of term-time short stay demand for your PBSA or university accommodation portfolio.